
Microbusinesses Performed $5.9 Billion of R&D in the United States in 2023
This InfoBrief presents research and development (R&D) data on microbusinesses, defined here as businesses with one to nine domestic employees. In 2023, microbusinesses reported a total of $8.3 billion in R&D costs, of which 86%, or $7.1 billion, was domestic and 72%, or $5.9 billion, was performed by the microbusinesses themselves (table 1). R&D costs include the amount that businesses spent of their own money and from other sources on R&D they performed, as well as the amount they paid others to perform R&D. This InfoBrief makes a distinction between R&D performance expenses, which are the costs only for R&D performed by the business, and R&D nonperformance costs, which are payments to others for R&D, including purchased R&D.
r = relative standard error > 50%.
Detail may not add to total because of rounding. Statistics are representative of companies located in the United States that performed or funded R&D. Selected industries include the 2022 North American Industry Classification System sectors 31, 32, 33, 42, and 51 and industries 5413, 5415, and 5417.
National Center for Science and Engineering Statistics and Census Bureau, 2024 Annual Business Survey: Data Year 2023.
Data for this InfoBrief are from the Annual Business Survey (ABS), developed and cosponsored by the National Center for Science and Engineering Statistics (NCSES) within the U.S. National Science Foundation and by the Census Bureau. The ABS is the primary source of information on R&D expenditures by microbusinesses. Additionally, the ABS collects data related to innovation, intellectual property, technology, and business owner characteristics from both microbusinesses and companies with 10 or more employees. This InfoBrief reviews both the R&D totals for the microbusiness population and specifics for selected industries.
This InfoBrief and the related full set of data tables result from a multiyear collaboration between NCSES and the Census Bureau on the ABS.
Microbusiness R&D Trend
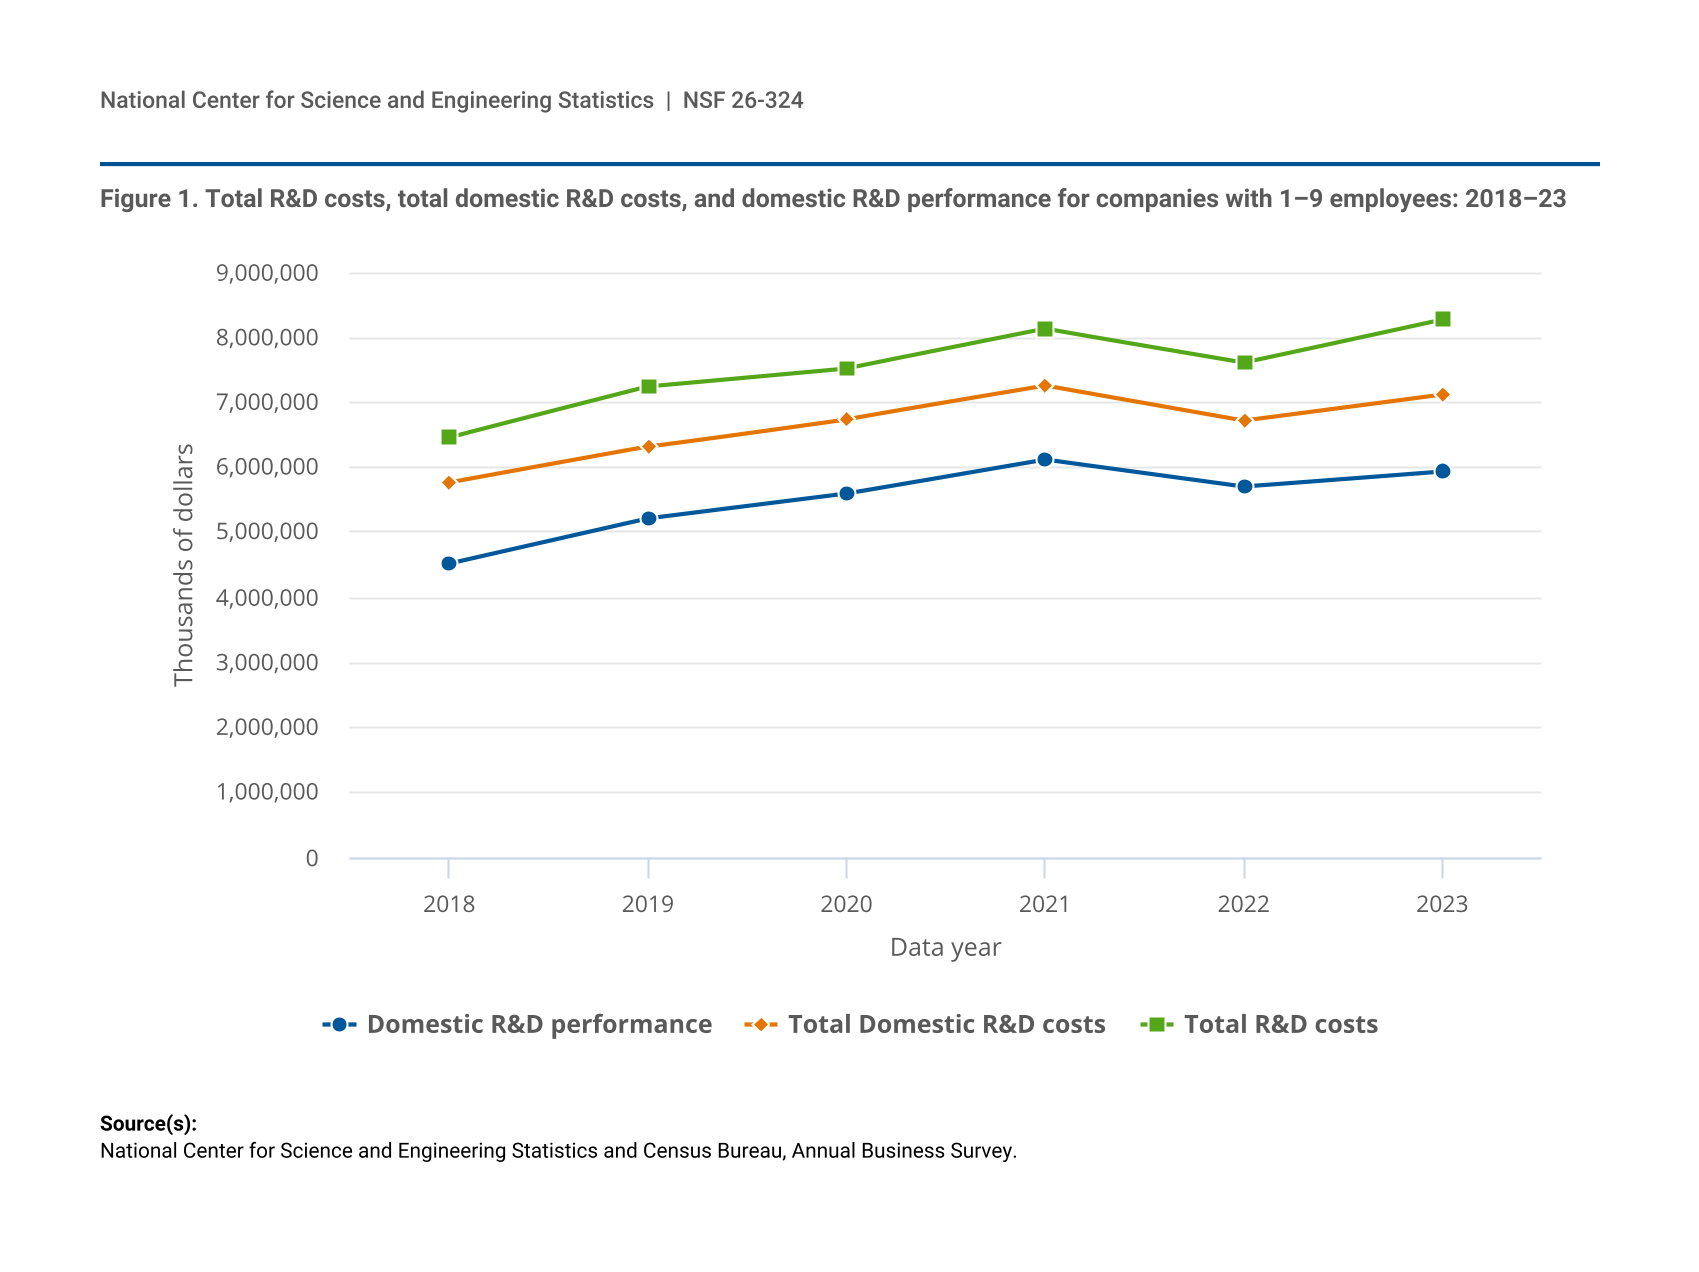
Figure 1 presents the trajectory of total R&D costs, total domestic R&D costs, and R&D performance for microbusinesses for the 2018–23 time frame. Total domestic R&D performance increased 31% from 2018 to 2023 ($4.5 billion to $5.9 billion). Total R&D costs increased 28% over the same time period, from $6.5 billion to $8.3 billion. Domestic R&D costs increased 23%, from $5.8 billion in 2018 to $7.1 billion in 2023.
| Data year | Domestic R&D performance | Total Domestic R&D costs | Total R&D costs |
|---|---|---|---|
| 2018 | 4,526,838 | 5,766,729 | 6,467,338 |
| 2019 | 5,218,911 | 6,316,312 | 7,245,649 |
| 2020 | 5,600,668 | 6,743,889 | 7,522,839 |
| 2021 | 6,124,669 | 7,254,217 | 8,131,847 |
| 2022 | 5,710,570 | 6,715,757 | 7,616,415 |
| 2023 | 5,943,753 | 7,118,582 | 8,283,032 |
National Center for Science and Engineering Statistics and Census Bureau, Annual Business Survey.
In 2023, domestic R&D costs by microbusinesses in the United States were approximately $7.1 billion (table 1), of which $1.2 billion was for outsourced R&D and the remaining $5.9 billion (or 83%) was for R&D performed by the microbusinesses themselves. This proportion is not significantly different from that found in 2022, where 85% of domestic R&D was performed by the microbusinesses.
R&D by Type of Costs
Of the $7.1 billion in domestic R&D costs in 2023, 56% was for salaries, wages, and fringe benefits (table 2). For manufacturing businesses, 49% of domestic R&D costs was spent on salaries, wages, and fringe benefits; for selected nonmanufacturing businesses, it was 57%. The software publishers industry (NAICS [North American Industry Classification System code] 5112) spent an even larger proportion of its domestic R&D costs on salaries, wages, and fringe benefits (84%).
r = relative standard error > 50%.
NAICS = 2022 North American Industry Classification System.
Detail may not add to total because of rounding or unavailable NAICS detail for select records beyond the 4-digit industry classification. Industry classification is based on dominant establishment payroll. Statistics are representative of companies located in the United States that performed or funded R&D.
National Center for Science and Engineering Statistics and Census Bureau, 2024 Annual Business Survey: Data Year 2023.
Other types of costs for domestic R&D included payments to others for R&D (17%), materials and supplies (8%), expensed machinery and equipment (2%), and depreciation on R&D property and equipment (1%). The remaining 16% was used for other expenses, such as consultants, contractors, travel, or rent.
Characteristics of Microbusiness R&D Performance
By Industry
Domestic R&D performed by the company equaled $5.9 billion in 2023. As was the case in findings from previous ABS cycles, microbusiness R&D was highly concentrated within a few industries in 2023.
Selected nonmanufacturing industries accounted for 91% of the microbusiness domestic R&D performance costs (table 3). Nearly, two-fifths of the microbusiness domestic R&D performance costs, or 36% of all domestic R&D costs, was from scientific research and development services (NAICS 5417). Computer systems design and related services (NAICS 5415) accounted for 26% of all microbusiness domestic R&D performance costs.
r = relative standard error > 50%.
NAICS = 2022 North American Industry Classification System.
Detail may not add to total because of rounding or unavailable NAICS detail for select records beyond the 4-digit industry classification. Industry classification is based on dominant establishment payroll. Statistics are representative of companies located in the United States that performed or funded R&D.
National Center for Science and Engineering Statistics and Census Bureau, 2024 Annual Business Survey: Data Year 2023.
Among the manufacturing industries (9% of all microbusiness domestic R&D performance costs), computer and electronic products (NAICS 334) made up 4%, followed by chemicals (NAICS 325) with 3% of the total domestic R&D performed by microbusinesses.
By Type of R&D
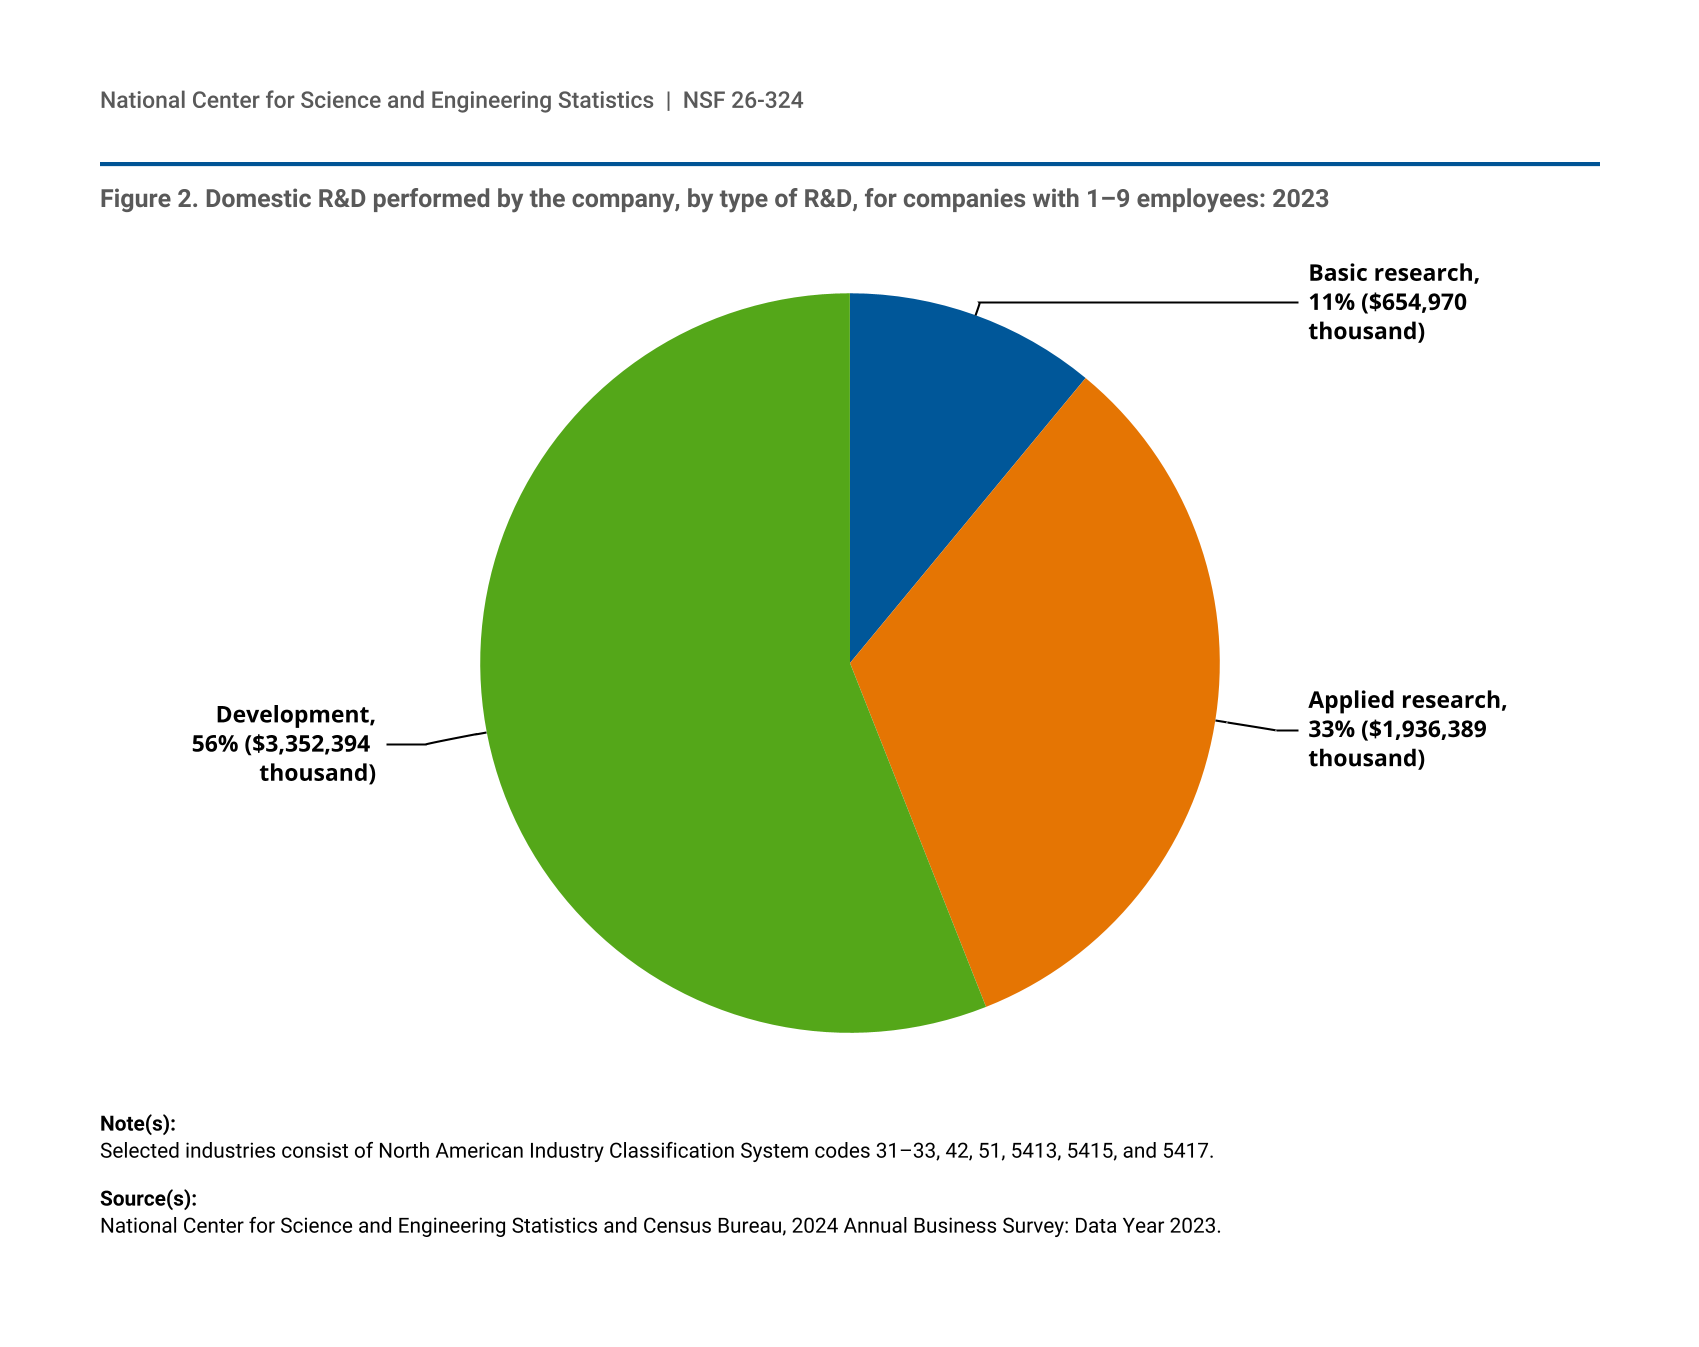
There are three types of R&D: basic research, applied research, and development. In 2023, 56% of microbusiness R&D performance was for development, 33% was for applied research, and 11% was for basic research (figure 2).
| Type of R&D | Percent | Thousands of dollars |
|---|---|---|
| Basic research | 11 | 654,970 |
| Applied research | 33 | 1,936,389 |
| Development | 56 | 3,352,394 |
Selected industries consist of North American Industry Classification System codes 31–33, 42, 51, 5413, 5415, and 5417.
National Center for Science and Engineering Statistics and Census Bureau, 2024 Annual Business Survey: Data Year 2023.
By Source of Funds
In 2023, over three-quarters (78%) of microbusiness R&D performance was paid for from the companies’ own funds; 11% was from federal, state, or local governments combined; 6% was from another U.S. company; and 3% was from a foreign owner (table 3). In the manufacturing industries, 64% of R&D was paid for by the company, compared with 80% in selected nonmanufacturing industries.
In scientific research and development services (NAICS 5417), the industry with the most domestic R&D performance costs, 68% of microbusiness R&D performance was self-funded and 19% was funded by federal, state, or local governments combined. In 2023, 62% of all government funding for microbusinesses went to scientific research and development services.
By State
In 2023, five states (California, Massachusetts, Texas, Pennsylvania, and New York) accounted for 50% of all domestic microbusiness R&D performance cost. In 2022, these same five states accounted for 54% of all domestic microbusiness R&D performance cost.
Total Employment and R&D Employees
There were nearly 41,000 domestic R&D employees (79% male and 21% female) working for microbusinesses in 2023 (table 4), and 89% of those domestic R&D employees were in the selected nonmanufacturing microbusinesses.
r = relative standard error > 50%.
NAICS = 2022 North American Industry Classification System.
Detail may not add to total because of rounding or unavailable NAICS detail for select records beyond the 4-digit industry classification. Detail across columns have been adjusted to add to total. Industry classification is based on dominant establishment payroll. Statistics are representative of companies located in the United States that performed or funded R&D.
National Center for Science and Engineering Statistics and Census Bureau, 2024 Annual Business Survey: Data Year 2023.
Among domestic R&D employees across all selected industries, the largest numbers of employees worked in the computer systems design and related services industry (NAICS 5415) and in the scientific research and development services industry (NAICS 5417), 32% and 25%, respectively.
R&D employee occupations include researchers (e.g., R&D scientists, engineers, and their managers), R&D technicians and equivalent staff, and R&D support staff (clerical and other). Among domestic R&D employees in 2023, 71% were researchers, and among these approximately 29,000 researchers, 27% have PhDs (table 5). Just over 9,000, or 22% of domestic R&D employees, were R&D technicians, and the remaining 2,800, or 7%, were R&D support staff.
r = relative standard error > 50%.
NAICS = 2022 North American Industry Classification System.
Detail may not add to total because of rounding or unavailable NAICS detail for select records beyond the 4-digit industry classification. Detail across columns have been adjusted to add to total. Industry classification is based on dominant establishment payroll. Statistics are representative of companies located in the United States that performed or funded R&D.
National Center for Science and Engineering Statistics and Census Bureau, 2024 Annual Business Survey: Data Year 2023.
Computer systems design and related systems (NAICS 5415) and scientific research and development services (NAICS 5417) have the greatest number of R&D employees, around 13,000 and 10,000, respectively. Of the approximately 8,000 researchers in the computer systems design industry, 12% have PhDs, whereas in the scientific research and development services industry, 56% of the researchers have PhDs.
Survey Information and Data Availability
In this InfoBrief, R&D costs and performance are expressed in current U.S. dollars and are not adjusted for inflation. For the ABS, a microbusiness is defined as a business organization located in the United States, either U.S.-owned or a U.S. affiliate of a foreign parent company, of one or more establishments under common ownership or control, with one to nine domestic employees.
The survey was administered to companies whether or not they were known to have R&D activity. The ABS collected detailed statistics from microbusinesses located in the United States on R&D expenditures, R&D employees, intellectual property, company and primary owner characteristics, and innovation activities.
Only microbusinesses (those businesses with one to nine employees) are asked the R&D questions, and data for only those microbusinesses are presented in this InfoBrief.
The statistics from the survey are based on a sample; as such, they are subject to both sampling and nonsampling errors (see the survey Technical Notes). All statistical tests were conducted at the 10% significance level unless specifically noted. Microbusinesses with less than $50,000 in R&D are excluded from the ABS national estimates and this InfoBrief.
For the full ABS 2024 (data year 2023), 330,000 employer companies were sampled to represent the population of 5.6 million employer companies, and the unit response rate was 64%.
The full set of data tables on R&D, company demographics, innovation, technology, and patent and intellectual property protection from this survey will be available in the report Annual Business Survey: 2024 (Data Year 2023) (https://ncses.nsf.gov/surveys/annual-business-survey/2024#data). Individual data tables and tables with relative standard errors and imputation rates from the ABS 2024 are available from NCSES upon request.
NCSES has reviewed this product for unauthorized disclosure of confidential information and approved its release (NCSES-DRN26-022).
Notes
1
Microbusinesses are defined as having between one to nine domestic employees. Employees are defined as individuals who worked for the business and received a W-2 issued by the business for salary or wages.
2
Reported percent changes are based on the data in the full set of tables (available at the ABS homepage) rather than the rounded values shown here.
3
R&D questions were asked only of manufacturers and certain selected nonmanufacturing industries. In previous NCSES surveys (2017 ABS, Business R&D and Innovation Survey–Microbusiness, and Business R&D Innovation Survey) these industries represented almost all R&D of microbusinesses in the United States.
4
As defined by the Frascati Manual, basic research is experimental or theoretical work undertaken primarily to acquire new knowledge of the underlying foundations of phenomena and observable facts, without any particular application or use in view. Applied research is original investigation undertaken in order to acquire new knowledge. It is, however, directed primarily toward a specific, practical aim or objective. Experimental development is systematic work, drawing on knowledge gained from research and practical experience and producing additional knowledge, which is directed to producing new products or processes or to improving existing products or processes. See Organisation for Economic Co-operation and Development (OECD). 2015. Frascati Manual: Guidelines for Collecting and Reporting Data on Research and Experimental Development. The Measurement of Scientific, Technological and Innovation Activities, 7th ed. Paris: OECD Publishing.
Suggested Citation
National Center for Science and Engineering Statistics (NCSES). 2026. Microbusinesses Performed $5.9 Billion of R&D in the United States in 2023. NSF 26-324. Alexandria, VA: U.S. National Science Foundation. Available at https://ncses.nsf.gov/pubs/nsf26324.
Contact Us
National Center for Science and Engineering Statistics
Directorate for Social, Behavioral and Economic Sciences
U.S. National Science Foundation
Tel: (703) 292-8780
FIRS: (800) 877-8339
TDD: (800) 281-8749
E-mail: ncsesweb@nsf.gov
Source: RSS Feed
Source: RSS Feed. Review credited third-party material before publication.